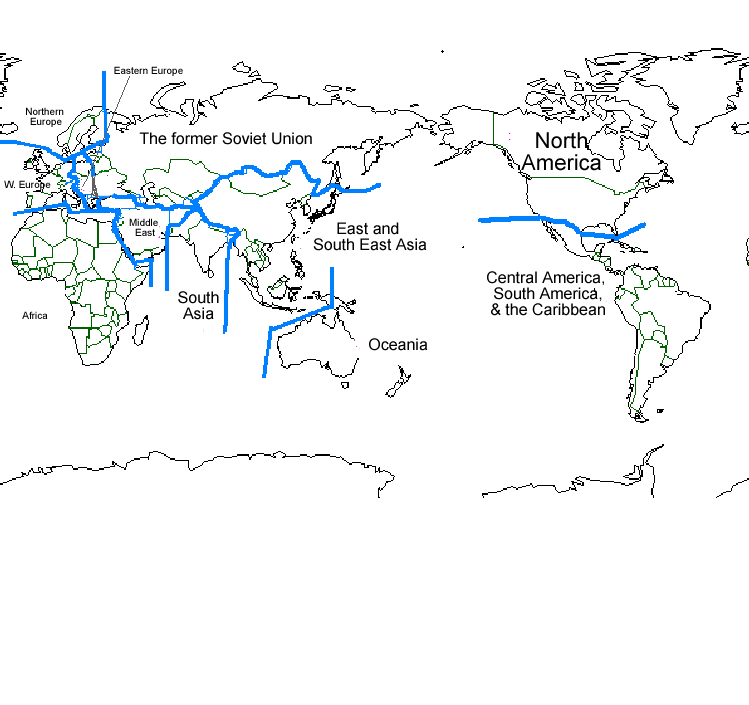

Pretend that
Please fill out the following chart with your group members:
Region |
Area | Population | Number of Dollar Bills | Number of $ per person |
|
Northern Europe |
1 |
0.4 |
||
|
Eastern Europe
|
1 |
2 |
||
|
Western Europe
|
2 |
6 |
||
|
The Former Soviet Union |
17 |
5 |
||
|
Africa |
23 |
13 |
||
|
Middle East |
5 |
4 |
||
|
South Asia |
3 |
22 |
||
|
East/South East Asia |
12 |
34 |
||
|
Oceania |
6 |
0.5 |
||
|
North America |
15 |
5 |
||
|
South/Central America |
15 |
8.4 |
||
|
Japan |
0.3 |
2 |
| Region | Area | Population | Number of Dollar Bills | Number of $ per person |
| Northern Europe | 1 | 0.4 | 2 | 5.8 |
| Easter Europe | 1 | 2 | 1 | 0.6 |
| Western Europe | 2 | 6 | 28 | 4.6 |
| The Former Soviet Union | 17 | 5 | 2 | 0.3 |
| Africa | 23 | 13 | 2 | 0.1 |
| Middle East | 5 | 4 | 2 | 0.5 |
| South Asia | 3 | 22 | 2 | 0.1 |
| East/South East Asia | 12 | 34 | 20 | 0.6 |
| Oceania | 6 | 0.5 | 2 | 3.2 |
| North America | 15 | 5 | 32 | 6.4 |
| South/Central
America and the Caribbean |
15 | 8.4 | 6 | 0.8 |
| Japan | 0.3 | 2 | 14 | 6.5 |
Source of data :世界の国一覧表 2001年版(財団法人 世界の動き社
Translated from the following webpage: http://www.joca.or.jp/ob-kai/krk/world100/world100.htm